Dashboard
The Dashboard page offers comprehensive graphical representations of various aspects of your salon management system, including performance metrics, appointment and revenue trends, as well as top-performing services. This allows for quick analysis and interpretation of essential information for effective decision-making.
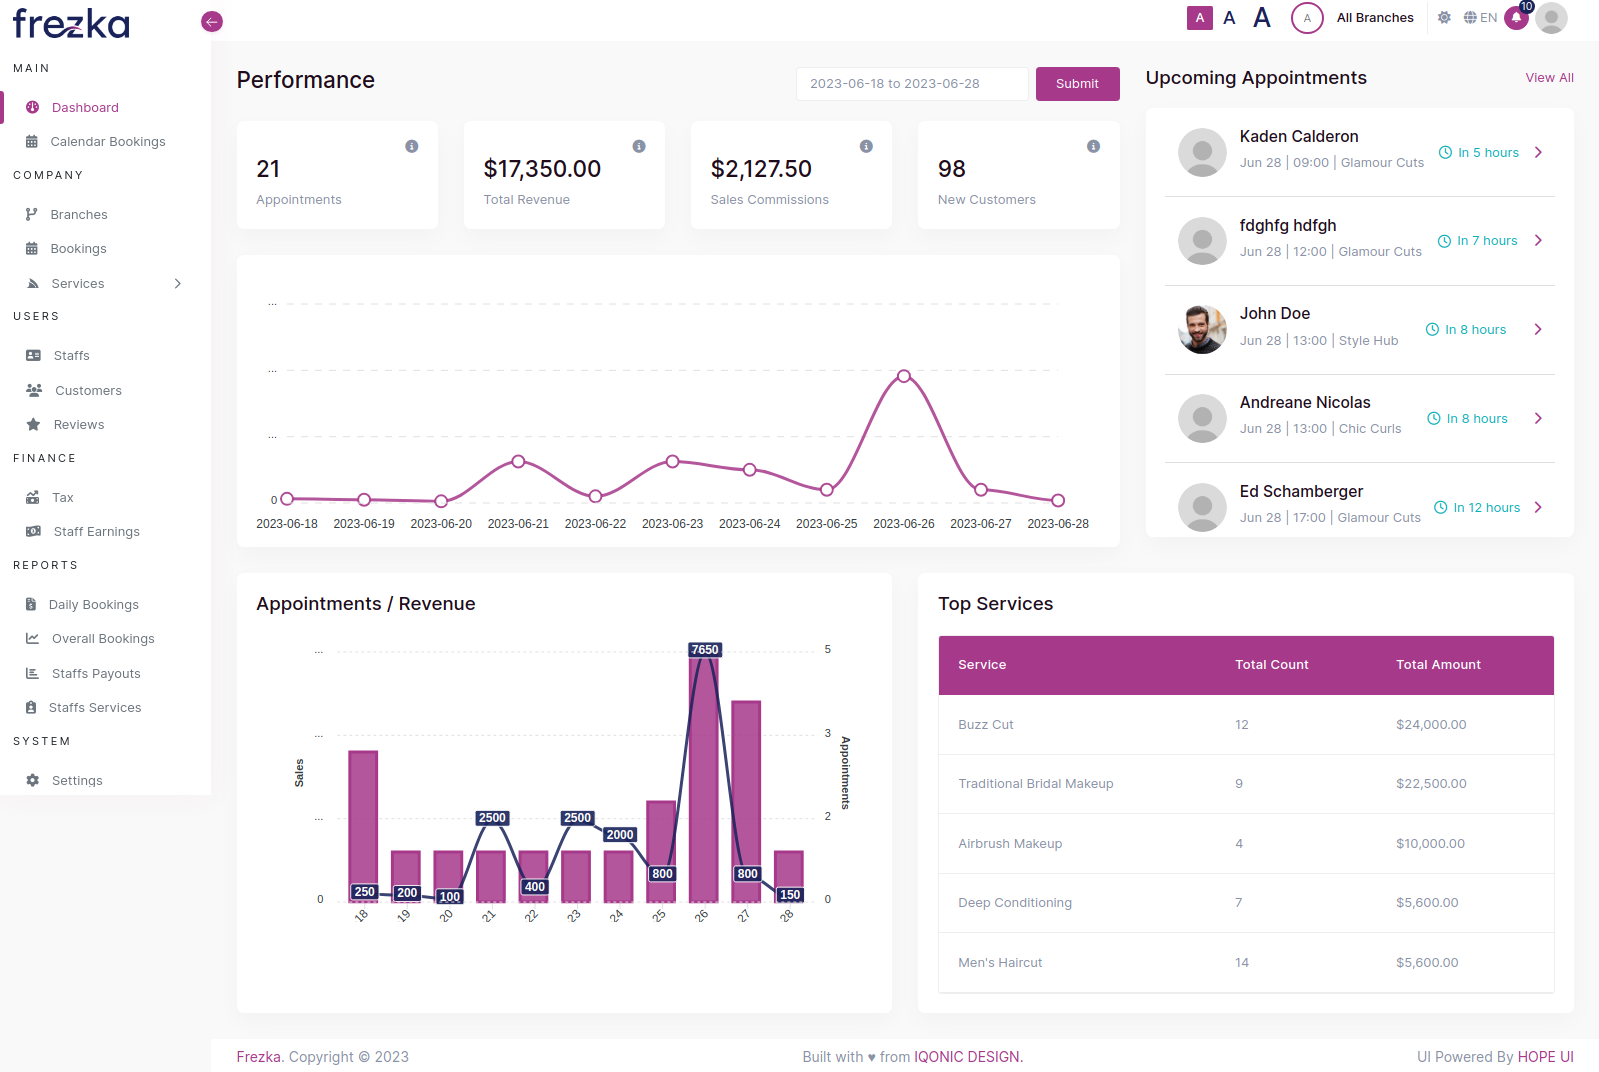
The filter button on the Dashboard page empowers you to adjust the data showcased in the graphs and charts. By selecting specific dates, you can update the visual representation to reflect the desired time range, enabling you to gain valuable insights and analyze the information effectively.

Performance: The Performance section on the Dashboard page provides a visual representation of your salon's sales performance, including the total number of appointments, revenue generated, commissions paid to staff members, and the number of new customers. It also includes a graph that displays the amount of sales over a selected period of time.
Appointment/Revenue: The Performance section on the Dashboard page showcases a bar graph that visually represents the total number of appointments and the corresponding revenue generated within the selected time period.
Upcoming Appointments: This section displays the upcoming appointments, showing the customer's name, appointment date, timing, and the type of service for the next five appointments.